Validation metrics are the lifecycle indicators that prove your validation program controls risk, meets compliance obligations, and runs efficiently. They are not machine-learning scores. The core categories that matter are operational metrics (protocol pass rates), control metrics (audit-trail review compliance), risk metrics (percentage of CAPAs originating from validation), velocity metrics (change impact turnaround time), and automation coverage. Mature organizations feed these into management review and APQR/PQR as inspection-ready evidence of continuous control.
TL;DR:
>
- Validation metrics should focus on control and velocity indicators, such as change impact turnaround time and audit trail review compliance, to ensure effective risk management.
- Building reproducible, owner-assigned metrics with clear data sources and review schedules is essential for inspection readiness and demonstrates ongoing control.
- Dashboards must display trend lines, Root Cause analysis, and evidence links, with regular owner and management reviews, to proactively identify and address issues.
- Moving from counting deviations to measuring process velocity and control provides a better signal of system health and readiness rather than relying solely on volume metrics.
- Automated validation documentation platforms can embed compliance checks and traceability, making metrics self-sufficient and reducing audit preparation time.
Table of Contents
- What Validation Metrics Should You Track First?
- How Do You Define a Metric So It Survives Inspection?
- What Should a Validation Metrics Dashboard Include?
- What Happens When a Validation Metric Trends Poorly?
- Why Counting Deviations Beats Nothing, but Still Misses the Point
- How Qualitum Turns Validation Metrics Into Evidence, Not Extra Work
- Sources
- FAQ
What Validation Metrics Should You Track First?
Every validation program generates data. Very little of it gets structured into something an inspector, or your own management team, can actually act on. The metrics below are the ones worth building a dashboard around, organized by what they prove rather than what they count.
Operational metrics tell you whether execution is working as designed.
- Protocol execution rate: (protocols executed on schedule ÷ protocols planned) × 100. Source: validation master schedule vs. execution log. Owner: Validation Manager. Review monthly. A falling rate usually signals resourcing gaps before it signals anything else.
- Protocol pass/fail rate: (protocols passed without deviation ÷ total protocols executed) × 100. Source: executed protocol records. Owner: Validation Lead. Review monthly, escalate below 85%.
- Deviations per protocol: total deviations ÷ total protocols executed. Source: deviation management system. Owner: QA. Review quarterly.
Control metrics measure whether your data integrity safeguards actually function.
- Audit trail review compliance: (audit trail reviews completed on time ÷ reviews due) × 100. Source: audit trail review log. Owner: QA Lead. Review monthly, escalate below 95%.
- Access review completion and findings: completion rate plus count of role removals or corrections identified. Source: user access review records. Owner: IT/QA jointly. Review quarterly.
Risk metrics connect validation performance to the broader quality system.
- Percentage of CAPAs originating from validation: (validation-sourced CAPAs ÷ total CAPAs) × 100. Source: CAPA system. Owner: QA. Review quarterly.
- Validation exceptions by root cause: categorized into requirements, environment, training, vendor, and integration. Source: exception/deviation records. Owner: Validation Manager. Review quarterly.
Velocity metrics show whether your organization moves fast enough to stay compliant without cutting corners.
- Change impact turnaround time: median days from change request to validation impact assessment completion. Source: change control system. Owner: Change Control Board. Review monthly, escalate above 10 business days.
- Change control to validation execution lag: median days between approval and first executed protocol. Source: change control and execution logs. Owner: Validation Manager. Review monthly.
Automation metrics measure how much of your critical testing runs without manual intervention: critical test automation coverage (%) and automated test failure rate, both sourced from your test execution platform and owned by the Validation Lead, reviewed monthly.
How Do You Define a Metric So It Survives Inspection?
A metric that cannot be reproduced during an inspection is worse than no metric at all. Regulators and auditors will ask where a number came from, who owns it, and what happened the last time it went sideways. If you can't answer instantly, the metric doesn't hold up.
Build every metric from the same template:
- Name and purpose: what the metric measures and why it matters to compliance or efficiency.
- Calculation logic: the exact formula, written in plain language and, ideally, stored as versioned code.
- Data source: the single system of record, not a spreadsheet someone updates by hand.
- Owner: one named role, not a department.
- Review cadence: how often it gets checked and by whom.
- Artifact of proof: the document or screenshot that shows the metric was reviewed and acted on.
Every record feeding a metric needs to pass ALCOA+ scrutiny at the point of capture and again at the point of reporting: attributable, legible, contemporaneous, original, and accurate, plus complete, consistent, enduring, and available. A risk-based validation approach applies this same discipline unevenly on purpose, tightening scrutiny where the risk tier is highest and loosening it where it isn't.
Before setting any target, run a retrospective analysis covering at least six months of history, segmented by validation type and risk tier. Guessing at thresholds without a baseline is how organizations end up chasing noise instead of signal.
Pro Tip: Reconcile manual and automated data sources before you trust either one. A metric pulled half from a spreadsheet and half from a validated system will drift the moment someone forgets to update a cell, and that drift is exactly what an auditor will find first.
What Should a Validation Metrics Dashboard Include?
A dashboard earns its place in an inspection binder when it does more than display numbers. It needs to show trend, target, and root cause on a single screen, with a direct line from every tile to the evidence behind it.

Keep the layout to six or eight core tiles, each with a 12 month trend line, the current value against target, and the top contributing root causes. Annotate the trend line itself: mark the point where a CAPA opened, a major system change went live, or a release shipped, so a reviewer can trace a shift in the line straight to the event that caused it.
Recommended QA dashboards favor a few visualization habits that hold up under scrutiny: moving averages instead of raw daily counts, control limits that flag statistically meaningful shifts, heatmaps by system or validation type, and aging swimlanes for any open action past its due date.
Cadence matters as much as layout. Owners review their metrics weekly, management reviews them monthly in a QBR-style forum, and the full set feeds into quarterly APQR and PQR documentation. Every tile should link directly to its underlying evidence, whether that's a protocol report, an audit trail snapshot, or a CAPA record, because regulators expect trending, not just reporting.
For examples of how dashboard tiles can be configured to support this kind of drill-through, laboratory teams have documented practical dashboard configuration approaches worth studying even outside a LIMS context.
What Happens When a Validation Metric Trends Poorly?
A metric that slips without triggering an action is decoration, not governance.
Escalation follows a fixed ladder every time:
- Metric owner investigates within five business days and documents an initial snapshot.
- QA lead reviews the root cause analysis and confirms whether a CAPA is warranted.
- Management review receives the finding if the trend persists past one reporting cycle or crosses a hard threshold.
Document every investigation the same way: a snapshot of the metric at the time of the flag, the root cause, a corrective plan with a named owner and due date, and the verification evidence that closes it out. A slow change impact turnaround time typically points to a resourcing gap and often resolves through a CAPA tied to staffing or workflow redesign. Recurring audit trail review failures usually point to a system problem, not a training gap, and warrant a remediation project rather than another round of retraining. Auditors expect exactly this trail: the metric snapshot, the linked CAPA or meeting minutes, and the closure evidence, in that order.
Why Counting Deviations Beats Nothing, but Still Misses the Point
Most validation dashboards I have reviewed count things. They count deviations, they count CAPAs, they count protocols executed. Counting is easy and it satisfies an auditor's first question, but it stops well short of proving control.
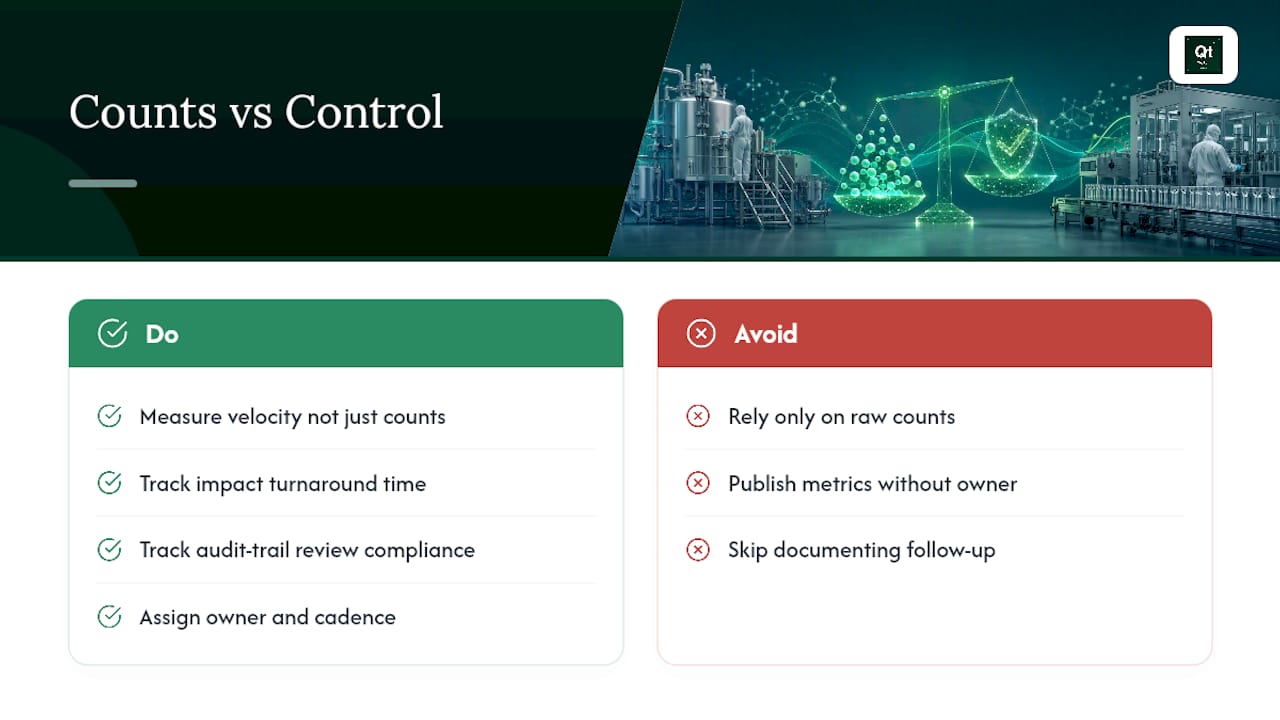
The shift worth making is from volume to velocity and control. A rising CAPA count might mean your process is deteriorating, or it might mean your team finally started catching problems it used to miss. Change impact turnaround time, audit trail review compliance, and automation coverage tell you something a raw count never will: whether the system around your validation work is actually functioning.
None of that matters without ownership. A metric with no named owner, no cadence, and no documented follow-up is a chart nobody will defend when questioned. Build the ownership and the evidence trail first, and the dashboard becomes something worth showing an inspector rather than something you hope they skip.
— Matt
How Qualitum Turns Validation Metrics Into Evidence, Not Extra Work
Every metric in this guide depends on clean, defensible records, and that is exactly where most validation teams lose time. Qualitum's agentic platform authors validation lifecycle documentation directly, from URS through IQ, OQ, and PQ, with every record checked against ALCOA+ at write-time and again at review-time, so the audit trail compliance and data integrity metrics above are built in rather than reconstructed after the fact.

The platform maintains a live traceability matrix, links evidence to change control and CAPA records automatically, and integrates with the quality management systems you already run, which is what makes velocity metrics like change impact turnaround time improve instead of just get measured. If you want to see how this maps to your current metric gaps, book a working session with the Qualitum team and bring your dashboard.
Sources
Key references for validation metrics and computerized system validation practice: QMS-linked validation performance indicators, CSV KPIs quality leaders track, risk-based CSV guidance, and medical device validation compliance guidance.
- QMS-Linked Validation Performance Indicators: Pharma Metrics for Quality and Compliance – Pharma Validation
- Computerized System Validation KPIs and Metrics Every Quality Leader Should Track – QMSGuide
- Computer System Validation (CSV): A Risk-Based Guide | cGMP Consulting
- QA Ops Metrics That Matter: A Mini Dashboard for Modern Validation Teams - Validation Insights
FAQ
What Are the Most Important Validation Metrics to Track?
Protocol pass/fail rate, audit trail review compliance, percentage of CAPAs originating from validation, and change impact turnaround time cover operational, control, risk, and velocity dimensions respectively.
How Often Should Validation Metrics Be Reviewed?
Owners should review their metrics weekly or monthly depending on volatility, management should see them monthly in a QBR-style forum, and the full set belongs in quarterly APQR/PQR documentation.
What Is a Realistic Baseline for a New Validation Metric?
Run a retrospective analysis across at least six months of historical data, segmented by validation type and risk tier, before setting any target or escalation threshold.
Why Do Access Review Findings Count as a Good Sign?
Removals and role corrections found during an access review demonstrate an active, functioning control rather than a failure, which is why auditors weigh the finding count alongside the completion rate.
Can Automation Improve Validation Metrics Directly?
Yes. Automating documentation and ALCOA+ checks at write-time, as Qualitum's platform does, directly improves authoring time, CSV cycle length, and audit trail compliance rather than just reporting on them after the fact.
Recommended
- Validate·AI
- Audit Readiness Checklist for Validation and QA Leaders
- Cleaning validation
- Cleanroom & utility qualification
FAQ
What Are the Most Important Validation Metrics to Track?
Protocol pass/fail rate, audit trail review compliance, percentage of CAPAs originating from validation, and change impact turnaround time cover operational, control, risk, and velocity dimensions respectively.
How Often Should Validation Metrics Be Reviewed?
Owners should review their metrics weekly or monthly depending on volatility, management should see them monthly in a QBR-style forum, and the full set belongs in quarterly APQR/PQR documentation.
What Is a Realistic Baseline for a New Validation Metric?
Run a retrospective analysis across at least six months of historical data, segmented by validation type and risk tier, before setting any target or escalation threshold.
Why Do Access Review Findings Count as a Good Sign?
Removals and role corrections found during an access review demonstrate an active, functioning control rather than a failure, which is why auditors weigh the finding count alongside the completion rate.
Can Automation Improve Validation Metrics Directly?
Yes. Automating documentation and ALCOA+ checks at write-time, as Qualitum's platform does, directly improves authoring time, CSV cycle length, and audit trail compliance rather than just reporting on them after the fact.